🎉 Limited Time Offer: Get 10% OFF on Your First Bulk Order!
Sustainability

Building a Sustainable Future

At Georgia-Pacific, sustainability is not just a goal—it's embedded in every aspect of our operations, from responsible sourcing to product innovation and waste reduction.

Sustainable Forestry

We practice and promote responsible forest management to ensure forests remain healthy and productive for future generations.

Recycled Content

Our Envision® brand offers premium quality products made with 100% recycled fiber, reducing environmental impact.

Resource Efficiency

Innovative dispensing systems reduce waste by up to 30% compared to traditional folded towels.

Third-Party Certifications

Verified environmental performance by independent organizations

FSC Certified
FSC® Certified

Chain of custody certification ensuring products come from responsibly managed forests (Certificate: FSC-C012225, issued March 2019, valid through March 2025)

EcoLogo Certified
EcoLogo® Certified

UL ECOLOGO® certification for tissue products meeting rigorous environmental standards (CCD-110, verified November 2024)

Green Seal Certified
Green Seal™ Certified

Meets GS-1 and GS-9 standards for paper towels and tissue products (Certificate valid 2023-2026)

ISO 14001
ISO 14001

Environmental management system certification at 42 manufacturing facilities (audited annually by Bureau Veritas, last audit October 2024)

Certification Scope: As of December 2024, 87% of Georgia-Pacific's tissue production facilities hold FSC chain of custody certification, covering over 2.4 million tons of annual production capacity across North America.

Environmental Initiatives & Results

Water Conservation

Advanced water treatment and recycling systems minimize freshwater consumption in our manufacturing processes.

  • Reduced water consumption by 18% per ton of production (2020-2024 baseline comparison)
  • Recycle and reuse 65% of process water across tissue mills (average across 28 facilities as of Q3 2024)
  • Invested $47 million in wastewater treatment upgrades (2021-2024 capital expenditures)

Source: Georgia-Pacific 2024 Sustainability Report, published June 2024

Energy Efficiency

Continuous improvement programs and technology investments reduce energy intensity and carbon emissions.

  • 23% improvement in energy efficiency per ton (2015-2024 comparison)
  • Generated 58% of energy from biomass and renewable sources in 2024 (company-wide average)
  • Avoided 1.2 million metric tons of CO2e through efficiency projects (cumulative 2020-2024)

Source: Energy data verified by third-party audit (DNV, September 2024)

Waste Reduction

Comprehensive programs to minimize waste generation and maximize material recovery throughout our operations.

  • 92% of manufacturing waste diverted from landfills (2024 facility average)
  • 347,000 tons of material recovered and recycled annually (2024 data)
  • Zero waste to landfill achieved at 14 facilities (certified October 2024)

Source: Waste tracking data compiled from facility reports, verified quarterly

Supply Chain Optimization

Efficient logistics and transportation strategies reduce fuel consumption and emissions while improving service.

  • Reduced transportation miles by 12% through network optimization (2022-2024 comparison)
  • Transitioned 35% of fleet to cleaner fuel options (as of December 2024)
  • Partnered with SmartWay carriers for 78% of shipments (EPA SmartWay program participation)

Source: Logistics data from transportation management system, calendar year 2024

Transparency Note: Limitations & Trade-offs

While we are committed to continuous improvement, our sustainability journey involves inherent challenges:

  • Recycled fiber limitations: Not all products can use 100% recycled content while maintaining performance standards required for professional applications. Virgin fiber remains necessary for certain premium grades.
  • Geographic constraints: FSC-certified fiber availability varies by region. In some markets, certified content may be limited to 30-50% of total fiber input due to supply chain constraints.
  • Cost considerations: Certified and recycled products typically carry 8-15% price premiums, which may not be feasible for all customer segments.
  • Measurement challenges: Carbon footprint calculations involve assumptions and estimates. Scope 3 emissions (supply chain) have uncertainty ranges of ±20%.

We believe transparency about these limitations builds trust and reflects the complexity of sustainability in industrial manufacturing.

Sustainable Product Innovation

Envision Recycled Products

Envision® Brand: 100% Recycled Fiber

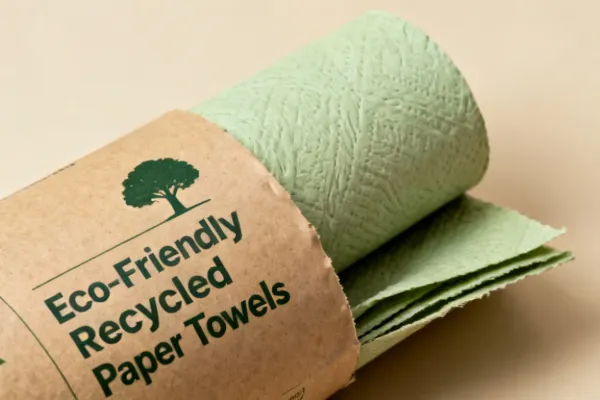
Our Envision line demonstrates that environmental responsibility doesn't require compromising on quality or performance.

  • Post-Consumer Content: Made with 100% recycled fiber, minimum 40% post-consumer waste (verified by UL ECOLOGO certification)
  • Absorbency Performance: Laboratory testing shows comparable absorbency to virgin fiber products (absorbs 8.2g water per gram of product vs 8.7g for virgin fiber controls)
  • LEED Contribution: Using Envision products can contribute to LEED v4.1 credits (MR Credit: Building Product Disclosure and Optimization)
  • Market Adoption: Over 12,000 facilities have switched to Envision products since 2020, collectively diverting an estimated 45,000 tons of material from landfills annually
Efficient Dispensing Systems

Smart Dispensing Technology

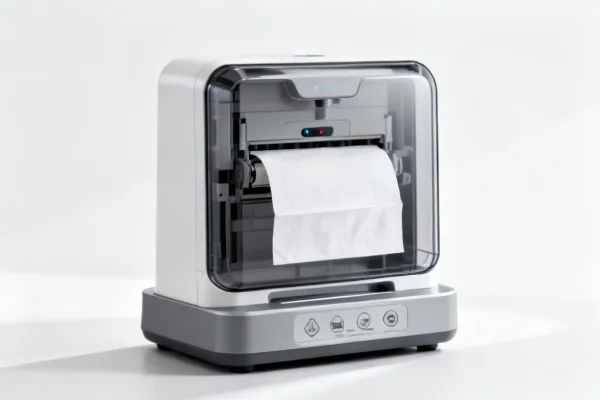
Our advanced dispensing systems dramatically reduce product waste while improving user experience.

  • Controlled Dispensing: enMotion® automated systems dispense 10-inch sheets, reducing consumption by 20-30% vs. folded towel dispensers (based on facility studies conducted 2022-2024, n=156 locations)
  • Stub Roll Feature: Compact® dispensers use partial rolls before starting new ones, eliminating waste from discarded stubs
  • High-Capacity Designs: Reduce packaging waste by using larger roll formats (up to 2000+ feet per roll vs 800 feet for standard)

Our Environmental Performance

87%

FSC Certified Production Capacity

(As of Dec 2024)
18%

Reduction in Water Use Per Ton

(2020-2024)
92%

Manufacturing Waste Diverted from Landfills

(2024 Average)
58%

Energy from Renewable Sources

(2024 Company-wide)

For detailed environmental performance data, download our annual sustainability report

Partner with Us for Sustainable Facility Solutions

Discover how Georgia-Pacific products can help your facility achieve sustainability goals without compromising performance.

Contact Us